What we learned about hockey analytics in 2016

Less than a decade ago, the hockey analytics community was centered on a handful of blogs and data-scraping websites. Today the field is far more diverse, with people of differing background and experience contributing new ideas and an increasing amount of overlap between the numbers people and the professional hockey men at the top of the NHL food-chain.
The explosion in the field over the last 10 years, along with the steadily increasing number of top contributors disappearing into NHL organizations make it difficult to offer a capsule summary of everything that’s going on across the league. There are, however, some broad areas where significant progress was made in 2016 and which bear watching in 2017.
The rise of microstats
John Chayka’s promotion to general manager of the Arizona Coyotes over the summer was hailed as a big win for analytics in hockey, but it was a win for a very particular field: microstats. Chayka’s background, with the analytics company Stathletes, involved tracking myriad data points beyond goals, assists or even shot attempts.
Chayka may be the most visible advocate for this type of approach, but he’s far from alone. From zone entries and exits to royal road passes to puck recoveries to battles won, new metrics are being born with stunning regularity.
In some cases, these new stats help illuminate the things that matter in hockey. For example, when Corey Sznajder tracked every zone entry in the league in 2013-14, he made it possible to identify which forwards were carrying the puck into the opposition zone. Some top forwards would carry the puck in rather than dumping it 80 percent of the time, while lesser forwards might have the opposite ratio:

While it’s a vibrant, exciting time for hockey analytics it’s also a period of great uncertainty.
The NHL’s official play-by-play sheets, despite their real failings, provide a lot of credible data available to anyone. Quality is a potential issue with the new data, as is transparency. The fact that many purveyors of the new numbers have a vested interest in selling them serves to complicate matters, especially if they dole out only the highlights.
Critically, even a transparently and capably tracked metric that describes what’s happening on the ice can be worse than useless if it doesn’t also predict what’s likely to come next. Descriptive stats are seductive because they show what’s happening on the ice, but like a career eight percent shooter scoring at a 23 percent clip they can be misleading.
2016 saw a welcome explosion in the prevalence of these microstats. The task of the analytics community in 2017 and beyond will be identifying the ones that actually drive results, and dismissing the rest.
Increased appreciation of context

Even as new information becomes available, older contextual data has begun to be studied in more depth. And we aren’t talking solely about things like quality of competition and shift starts (both of which remain areas of active debate), but rather more elementary concerns like handedness.
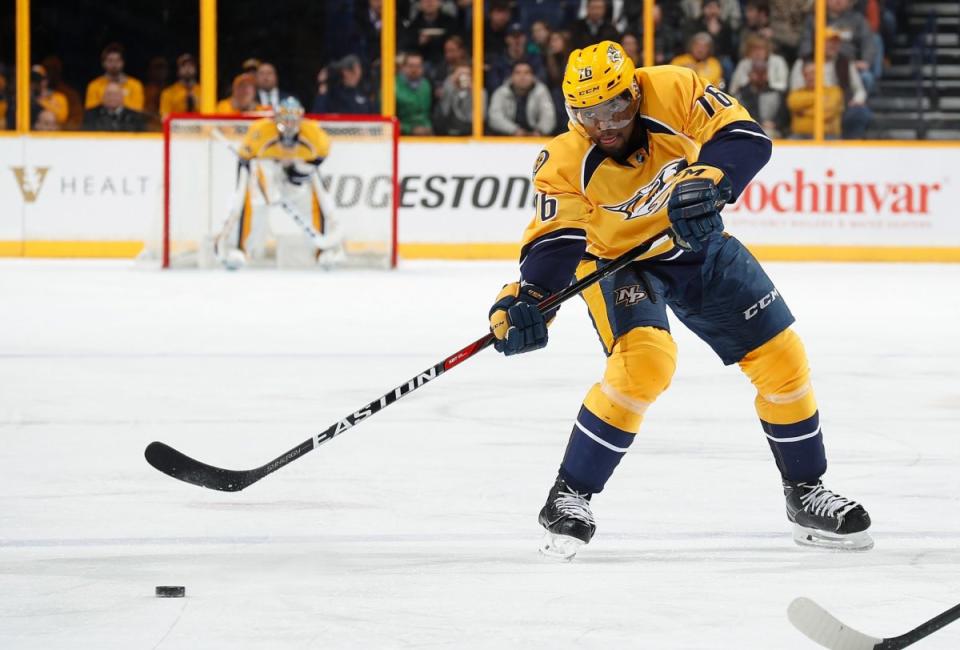
It’s long been a truism in conventional hockey thought that handedness matters—think of P.K. Subban’s difficulties making Team Canada—but it had long been underexplored on the analytics side. Domenic Galamini’s work, published in March, helped change all that. Galamini found that defence pairings in which a player played on his off-side (i.e. a left-shooting defenceman playing on the right side of the ice) suffered a massive disadvantage compared to tandems with two players on their strong sides.
Others have pushed further. It’s long been known that shooting from the off-wing increases the chance of scoring (any doubt was erased by a Matt Cane paper in 2014). Yet there’s more to it than that. Tyler Dellow, most recently a consultant for the Edmonton Oilers, has helped drive forward the conversation about how left-shot/right-shot combinations work on power plays, seeing what kind of groupings best drive goals for.
These are the kinds of things that coaches have long believed in, but that’s important, too. Not only is a wider array of variables being considered, but as the scope expands we come closer to speaking the same language as traditional hockey men, which serves to increase the flow of ideas in both directions. 2017 should see continued progress along these lines.
Single-output models

While analysts push ever outward, expanding their datasets, considering new variables and increasingly bridging the gap between conventional wisdom and mainstream analytical thought, there’s also a desire in some quarters to boil things down to a single output, one number that would unify all these disparate parts.
Models that boil hockey down to a single metric have been attempted before, going at least as far back as Tom Awad’s GVT in the early 2000’s, but 2016 saw several impressive new entries into the field. From Wins Above Replacement to Emmanuel Perry’s K metric, there’s a dedicated push from top analysts to create a reasonably comprehensive model that would capture total player contributions into just one number.
The danger in looking past component pieces should be obvious, particularly since each advance on the analytics side demonstrates how much there is yet to learn. Yet there are also undeniable benefits to objectively weighing myriad factors and even solely as a short-hand or starting point such statistics could be incredibly valuable.
The modern era of NHL analytics started in earnest in 2007-08, and as we approach the end of the first decade we find limitless opportunity still exists over the horizon.
This short summary doesn’t come close to capturing all the significant work done in the last year, yet even here the room for growth is staggering. A vast expansion in what we measure and how we measure it is just beginning. A greater appreciation of on-ice context works hand-in-hand with the new data, merging analytics with more traditional forms of assessment to provide an evidence-driven approach which should have value to hockey people from either school.
It’s easy to get lost in the vitriol of online conversation and petty disagreements over which approach to this new world is best, but to do so is to lose sight of the forest for the trees. Impressive advancements were made in 2016 and 2017 promises further growth. This is an exciting time for any serious student of the game.

 Yahoo Sports