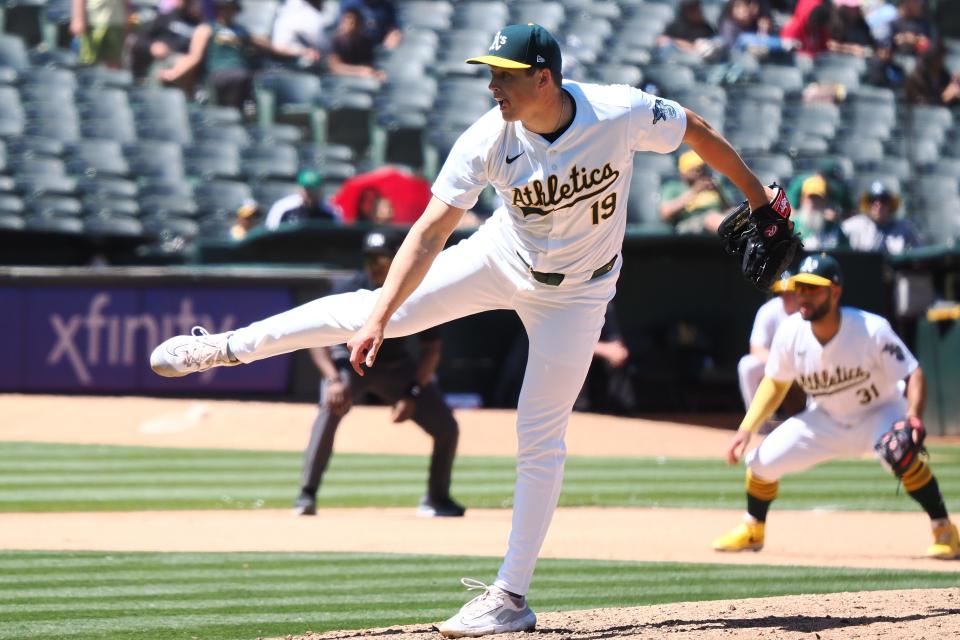
Putting Oakland Athletics' reliever Mason Miller's historic run into perspective

Anybody who follows Major League Baseball has heard about Mason Miller. The Oakland Athletics' reliever has been nearly unhittable and at just 25 years old, he's set to be the best closer in baseball for years to come.
That's all very high praise, right? Is it even possible to give a pitcher more praise than that last paragraph? Probably not. So, how crazy would it be if I told you that it was underselling him? What if, in fact, Miller has been even better than I've led on? What if Miller has been so good that for parts of the season, some of his statistics defied logic? That's the level of dominance we are seeing right now.
Oakland's Mason Miller isn't just playing like the best reliever in baseball right now. He could very well be in the middle of the most dominant reliever stretch in MLB history. Here's why.
Mason Miller's insane statistics
As of writing this, Miller has pitched 24 innings, struck out 47 batters, walked seven (eight if you count an intentional walk), allowed 12 hits, five earned runs, and recorded a 1.88 ERA.
That all sounds good and well, but we've seen better ERAs from relievers before, right? Sure, but of the three relief pitchers to have won the MVP Award since 1980, only one (Rollie Fingers) had a lower ERA than what Miller has right now. Miller isn't on a great team and probably won't rack up a ton of saves this year, meaning his chances at the MVP Award are slim to none at this point, but that doesn't take away from what he's accomplished.
While the expectation might be for Miller to regress back to the mean as the season progresses, there's actually a good chance that he never does. Fielding Independent Pitching, or FIP, is a metric designed to take the luck factor out of baseball entirely. It does so by isolating the events a pitcher and hitter have total control over, leaving only strikeouts, walks, hit-by-pitches, and home runs. Balls in play are not counted because fielders have much more control over the outcome of balls in play than the pitchers that surrender them. Whatever plate appearances are left are then calculated on a scale similar to that of ERA. The lower the better, and if a pitcher is unlucky and surrenders a high batting average on balls in play, they're FIP is likely to be lower, indicating that his ERA might be better than it seems.
How low could you think Miller's FIP is? How low could someone who has pitched 24 innings have their FIP?
It's 0.09. Take fielding and baserunning out of the equation and Mason Miller surrenders 0.09 runs per nine innings. At his current pace, that would mean one run about every 100 innings pitched.
Obviously, Miller isn't that dominant, but it does show that Miller is actually better than his already stellar stats might lead you to believe. Advanced metrics like Expected ERA, or xERA, back this up. Baseball Savant lists Mason Miller's xERA at 1.06. Yes, that's the best in baseball, and it's a full half point lower than the next closest reliever, Atlanta's Joe Jimenez.
Miller leads all of baseball in every major expected category.
Expected Batting Average against: .117 (1st)
Expected Slugging Percentage against: .157 (1st)
Expected Weighted On-Base Average against: .162 (1st)
Take away the whole "expected" aspect, and he's still top-15 in MLB in every category. However, while everyone above him has higher expected totals, Miller's are lower.
In terms of batting average against (BAA), Miller is the only qualified pitcher in the top-20, with an xBAA lower than his actual BAA. The difference between his xBAA and actual BAA is .031. There isn't a single pitcher in the top-100 whose difference between xBAA and actual BAA is greater than Miller's.
How do these stats stack up historically?
In the history of Major League Baseball, there has only been one 19-game stretch as dominant in the strikeout department as we are currently seeing with Miller: 2020 Devin Williams.
While Miller has just 47 strikeouts in 24 innings so far, Williams recorded 48 in just 22.2 innings in 2020. Of every other reliever in MLB history with at least 30 strikeouts in a 19-game span, none had more strikeouts than Miller in fewer innings.
Oh, and if the MLB season ended today, Miller would be the only pitcher in history to have pitched at least 15 innings in a season with a FIP under 0.65. As a reminder, his FIP doesn't even come near that at 0.09.
Not to mention, all of this is being looked while taking Miller's one blowup game against Colorado into consideration. Miller surrendered three earned runs in 1.2 innings that game. Prior to that, Miller's previous 15 appearances saw him post a 0.00 ERA in 19.1 innings pitched. He struck out 40 batters, allowed only five baserunners, and held opponents to a .249 OPS.
His FIP during that stretch?
-0.39.
Until his blowup game against Colorado, Miller had a negative FIP on the season, according to Baseball-Reference. While I can't prove it, I'd be willing to bet that's never happened in MLB history.
This article originally appeared on USA TODAY: Oakland A's star Mason Miller is on an incredible historic run

 Yahoo Sports
