
 Yahoo Sports
 Are Investors Undervaluing SeaLink Travel Group Limited (ASX:SLK) By 20%?

How far off is SeaLink Travel Group Limited (ASX:SLK) from its intrinsic value? Using the most recent financial data, we'll take a look at whether the stock is fairly priced by taking the foreast future cash flows of the company and discounting them back to today's value. I will use the Discounted Cash Flow (DCF) model. Don't get put off by the jargon, the math behind it is actually quite straightforward.
We generally believe that a company's value is the present value of all of the cash it will generate in the future. However, a DCF is just one valuation metric among many, and it is not without flaws. If you want to learn more about discounted cash flow, the rationale behind this calculation can be read in detail in the Simply Wall St analysis model.
See our latest analysis for SeaLink Travel Group
Step by step through the calculation
We use what is known as a 2-stage model, which simply means we have two different periods of growth rates for the company's cash flows. Generally the first stage is higher growth, and the second stage is a lower growth phase. To begin with, we have to get estimates of the next ten years of cash flows. Where possible we use analyst estimates, but when these aren't available we extrapolate the previous free cash flow (FCF) from the last estimate or reported value. We assume companies with shrinking free cash flow will slow their rate of shrinkage, and that companies with growing free cash flow will see their growth rate slow, over this period. We do this to reflect that growth tends to slow more in the early years than it does in later years.
A DCF is all about the idea that a dollar in the future is less valuable than a dollar today, so we discount the value of these future cash flows to their estimated value in today's dollars:
10-year free cash flow (FCF) estimate
2020 | 2021 | 2022 | 2023 | 2024 | 2025 | 2026 | 2027 | 2028 | 2029 | |
Levered FCF (A$, Millions) | AU$8.80m | AU$29.3m | AU$51.8m | AU$64.8m | AU$76.7m | AU$87.0m | AU$95.8m | AU$103.3m | AU$109.6m | AU$115.0m |
Growth Rate Estimate Source | Analyst x2 | Analyst x3 | Analyst x3 | Est @ 25.17% | Est @ 18.29% | Est @ 13.48% | Est @ 10.12% | Est @ 7.76% | Est @ 6.11% | Est @ 4.95% |
Present Value (A$, Millions) Discounted @ 8.4% | AU$8.1 | AU$24.9 | AU$40.7 | AU$47.0 | AU$51.2 | AU$53.6 | AU$54.5 | AU$54.2 | AU$53.0 | AU$51.3 |
("Est" = FCF growth rate estimated by Simply Wall St)
Present Value of 10-year Cash Flow (PVCF) = AU$438m
After calculating the present value of future cash flows in the initial 10-year period, we need to calculate the Terminal Value, which accounts for all future cash flows beyond the first stage. For a number of reasons a very conservative growth rate is used that cannot exceed that of a country's GDP growth. In this case we have used the 10-year government bond rate (2.3%) to estimate future growth. In the same way as with the 10-year 'growth' period, we discount future cash flows to today's value, using a cost of equity of 8.4%.
Terminal Value (TV)= FCF2029 × (1 + g) ÷ (r – g) = AU$115m× (1 + 2.3%) ÷ 8.4%– 2.3%) = AU$1.9b
Present Value of Terminal Value (PVTV)= TV / (1 + r)10= AU$1.9b÷ ( 1 + 8.4%)10= AU$854m
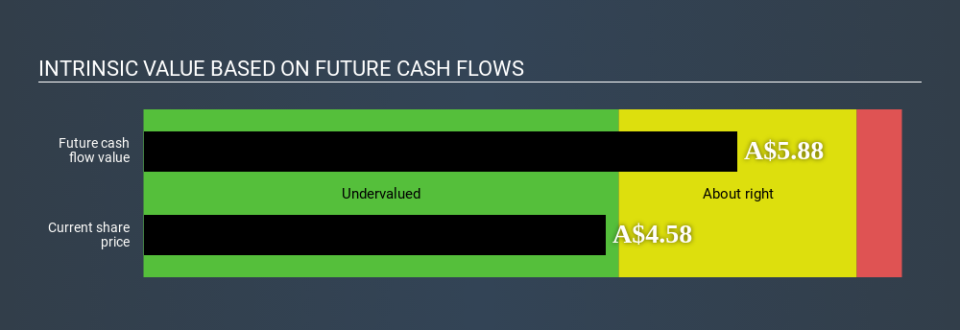
The total value, or equity value, is then the sum of the present value of the future cash flows, which in this case is AU$1.3b. To get the intrinsic value per share, we divide this by the total number of shares outstanding. Compared to the current share price of AU$4.7, the company appears a touch undervalued at a 20% discount to where the stock price trades currently. The assumptions in any calculation have a big impact on the valuation, so it is better to view this as a rough estimate, not precise down to the last cent.
The assumptions
We would point out that the most important inputs to a discounted cash flow are the discount rate and of course the actual cash flows. You don't have to agree with these inputs, I recommend redoing the calculations yourself and playing with them. The DCF also does not consider the possible cyclicality of an industry, or a company's future capital requirements, so it does not give a full picture of a company's potential performance. Given that we are looking at SeaLink Travel Group as potential shareholders, the cost of equity is used as the discount rate, rather than the cost of capital (or weighted average cost of capital, WACC) which accounts for debt. In this calculation we've used 8.4%, which is based on a levered beta of 1.022. Beta is a measure of a stock's volatility, compared to the market as a whole. We get our beta from the industry average beta of globally comparable companies, with an imposed limit between 0.8 and 2.0, which is a reasonable range for a stable business.
Next Steps:
Although the valuation of a company is important, it shouldn’t be the only metric you look at when researching a company. The DCF model is not a perfect stock valuation tool. Rather it should be seen as a guide to "what assumptions need to be true for this stock to be under/overvalued?" If a company grows at a different rate, or if its cost of equity or risk free rate changes sharply, the output can look very different. What is the reason for the share price to differ from the intrinsic value? For SeaLink Travel Group, We've put together three pertinent factors you should further research:
Risks: As an example, we've found 4 warning signs for SeaLink Travel Group (1 doesn't sit too well with us!) that you need to consider before investing here.
Management:Have insiders been ramping up their shares to take advantage of the market's sentiment for SLK's future outlook? Check out our management and board analysis with insights on CEO compensation and governance factors.
Other High Quality Alternatives: Do you like a good all-rounder? Explore our interactive list of high quality stocks to get an idea of what else is out there you may be missing!
PS. Simply Wall St updates its DCF calculation for every AU stock every day, so if you want to find the intrinsic value of any other stock just search here.
Love or hate this article? Concerned about the content? Get in touch with us directly. Alternatively, email editorial-team@simplywallst.com.
This article by Simply Wall St is general in nature. It does not constitute a recommendation to buy or sell any stock, and does not take account of your objectives, or your financial situation. We aim to bring you long-term focused analysis driven by fundamental data. Note that our analysis may not factor in the latest price-sensitive company announcements or qualitative material. Simply Wall St has no position in any stocks mentioned. Thank you for reading.
