
 Yahoo Sports
 Here's What Raisio plc's (HEL:RAIVV) P/E Is Telling Us

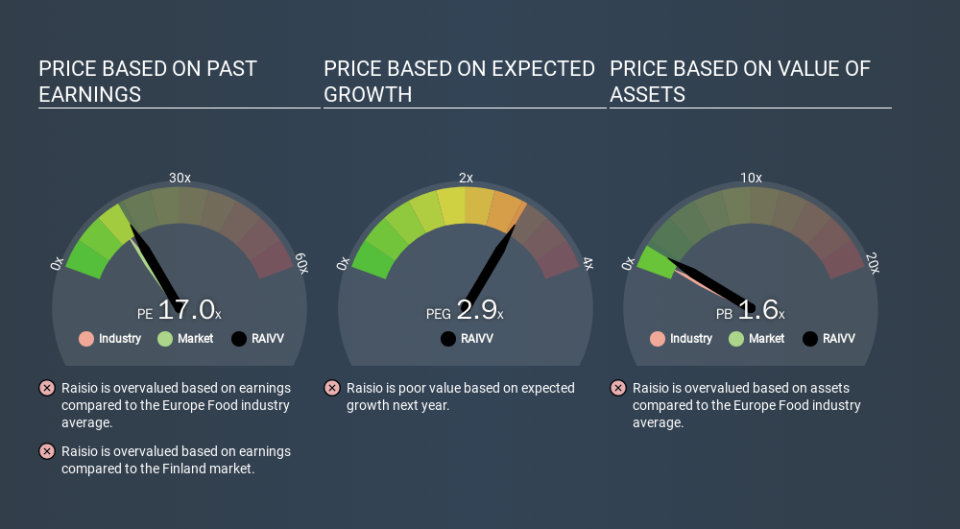
Today, we'll introduce the concept of the P/E ratio for those who are learning about investing. We'll look at Raisio plc's (HEL:RAIVV) P/E ratio and reflect on what it tells us about the company's share price. Raisio has a P/E ratio of 16.97, based on the last twelve months. That means that at current prices, buyers pay €16.97 for every €1 in trailing yearly profits.
Check out our latest analysis for Raisio
How Do You Calculate A P/E Ratio?
The formula for price to earnings is:
Price to Earnings Ratio = Share Price ÷ Earnings per Share (EPS)
Or for Raisio:
P/E of 16.97 = €2.750 ÷ €0.162 (Based on the year to December 2019.)
(Note: the above calculation results may not be precise due to rounding.)
Is A High P/E Ratio Good?
A higher P/E ratio implies that investors pay a higher price for the earning power of the business. That isn't a good or a bad thing on its own, but a high P/E means that buyers have a higher opinion of the business's prospects, relative to stocks with a lower P/E.
How Does Raisio's P/E Ratio Compare To Its Peers?
One good way to get a quick read on what market participants expect of a company is to look at its P/E ratio. The image below shows that Raisio has a higher P/E than the average (15.1) P/E for companies in the food industry.
Raisio's P/E tells us that market participants think the company will perform better than its industry peers, going forward. Clearly the market expects growth, but it isn't guaranteed. So investors should delve deeper. I like to check if company insiders have been buying or selling.
How Growth Rates Impact P/E Ratios
Generally speaking the rate of earnings growth has a profound impact on a company's P/E multiple. That's because companies that grow earnings per share quickly will rapidly increase the 'E' in the equation. And in that case, the P/E ratio itself will drop rather quickly. And as that P/E ratio drops, the company will look cheap, unless its share price increases.
Raisio's earnings made like a rocket, taking off 111% last year. The cherry on top is that the five year growth rate was an impressive 35% per year. With that kind of growth rate we would generally expect a high P/E ratio.
Don't Forget: The P/E Does Not Account For Debt or Bank Deposits
Don't forget that the P/E ratio considers market capitalization. In other words, it does not consider any debt or cash that the company may have on the balance sheet. The exact same company would hypothetically deserve a higher P/E ratio if it had a strong balance sheet, than if it had a weak one with lots of debt, because a cashed up company can spend on growth.
Spending on growth might be good or bad a few years later, but the point is that the P/E ratio does not account for the option (or lack thereof).
So What Does Raisio's Balance Sheet Tell Us?
Raisio has net cash of €100m. This is fairly high at 23% of its market capitalization. That might mean balance sheet strength is important to the business, but should also help push the P/E a bit higher than it would otherwise be.
The Bottom Line On Raisio's P/E Ratio
Raisio's P/E is 17.0 which is above average (14.7) in its market. The excess cash it carries is the gravy on top its fast EPS growth. To us, this is the sort of company that we would expect to carry an above average price tag (relative to earnings).
Investors should be looking to buy stocks that the market is wrong about. People often underestimate remarkable growth -- so investors can make money when fast growth is not fully appreciated. So this free report on the analyst consensus forecasts could help you make a master move on this stock.
You might be able to find a better buy than Raisio. If you want a selection of possible winners, check out this free list of interesting companies that trade on a P/E below 20 (but have proven they can grow earnings).
If you spot an error that warrants correction, please contact the editor at editorial-team@simplywallst.com. This article by Simply Wall St is general in nature. It does not constitute a recommendation to buy or sell any stock, and does not take account of your objectives, or your financial situation. Simply Wall St has no position in the stocks mentioned.
We aim to bring you long-term focused research analysis driven by fundamental data. Note that our analysis may not factor in the latest price-sensitive company announcements or qualitative material. Thank you for reading.
