
 Yahoo Sports
Fantasy Basketball: Trend Spotting

The common adage "One is an accident, two is a trend, three is a problem" can be aptly applied in football on a game-by-game, week-to-week basis with a 16-game schedule in place, but its application in basketball is a bit muddled. We're a little over 10 games into a 82-game schedule and still have a ways to go, but it's never too soon to take a look at some early-season statistical trends that are having a significant effect on player values.
What tends to happen once the season begins is that we get away from thinking at a more focused, categorical level and tend to generalize things. “Player A is having a breakout season and is putting up top-20 numbers; player B appears to be a bust and is ranked outside the top-150.” There’s a lot of general reporting of facts with some educated guesses thrown in as justification to buy low or sell high, but we don’t often see a close examination of why things are the way they are.
This will be a multi-part series, and I’ll kick things off by taking a detailed look at six players that currently rank inside the top-30 who we didn’t expect to end up there. I’ll start off by identifying which categories are “trending up”, meaning they are at least half of a standard deviation higher than the player’s three-year averages. I’ll break down this group of statistical trends then offer insight on what each player’s value will look like moving forward.
Before I get started, let me explain what I mean by the term ‘per-game value’ and how it is calculated. A site like Basketball Monster displays exactly how many standard deviations above or below the mean a player is in each category. This is an exact science that will allow you to see how big or small of an impact a player makes across the board. Each player’s per-game value is calculated by adding up the total sum of these categorical values and dividing them by the number of categories. In other words, per-game value calculates on average, how many standard deviations a player is above or below each categorical mean.
Last season’s benchmarks:
First-round value: +0.37 to +0.91
Second-round value: +0.23 to +0.32
Third-round value: +0.17 to +0.23
Fourth-round value: +0.09 to +0.16
Fifth-round value: +0.02 to +0.09
...and so on. So a player with a per-game value of 0.05 would have posted mid-to-late fifth round value last year. A player with a per-game value of 0.22 would have posted early-third round value.
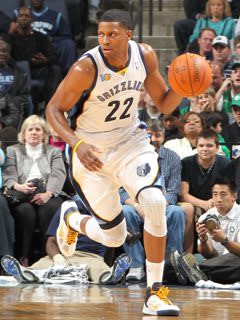
• Rudy Gay(notes), F, MEM (per-game rank: 3)
Trending up: PTS, REB, AST, FG%, FT%
Breakdown: Before I even looked at the numbers in depth, I suspected that two things were at least partially responsible for the increase in Gay’s counting stats: 1) the additional three overtime periods that Memphis has played in, and 2) the Zach Randolph(notes) injury, as it led to an expanded offensive role and more opportunities in general. I went ahead and calculated Gay’s per-game averages from the five non-overtime games where Randolph was healthy and compared them to his averages from the other seven games.
Non-overtime games w/ Randolph: 41.2 MPG, 20.2 PPG, 1.4 3PTM, 8.6 RPG, 3.2 APG, 1.2 SPG, 0.8 BPG, 2.4 TO, 16.8 FGA (46.4%), 3.4 FTA (94.1%)
Other games: 41.7 MPG, 25.7 PPG, 1.9 3PTM, 6.4 RPG, 2.9 APG, 2 SPG, 0.9 BPG, 2 TO, 20.1 FGA (52.5%), 3.3 FTA (82.6%)
In terms of per-game value for each data set, Gay posted a per-game value of 0.38 during the five non-overtime games with Randolph healthy, which would put him just outside the top-12. His per-game value in the other seven games was 0.86. Massive difference. A 0.48 differential is the difference between Chris Paul(notes) (1) and Wilson Chandler(notes) (27); the difference between Jrue Holiday(notes) (65) and Reggie Williams(notes) (225).
The points are normalized in the five-game data set, but the rebounds and assists are still way out of whack with his career averages of 5.6 rebounds and 1.8 assists. The rebound differential is basically coming straight from Marc Gasol’s(notes) share (-1.8 RPG), and given how Gasol’s rebound rate has increased in his first two seasons while Gay’s has decreased in each of the past four seasons, I doubt the 7.3 rebounds are sustainable. I don’t buy the spike in assists either. Over the past three seasons, Gay has only averaged more than 2.1 assists once in 21 monthly splits (April, 2007). To be at three per game now seems to be a mere outlier. The skepticism extends to the shooting percentages (50.2% FG, 87.5% FT). Gay is a career 76 percent free-throw shooter with a career-best of 78.5 percent. He is also taking less shots at the rim (-1.9 attempts) while attempting more long twos (+1.9 attempts) and threes (+1.7 attempts) and somehow his field-goal percentage has managed to increase by 3.6 percent. If anything, I would expect his worsened shot selection to cause a considerable dip in his shooting percentage.
Forecast: Gay may improve incrementally upon his averages from last season and finish inside the top-40, but I don’t see a legitimate reason to be much more optimistic about his prospects this season than in ones prior. The Grizzlies team situation remains one of the more stable ones out there, and it is clear that his current per-game rank is more reflective of big games with Randolph sidelined than of actual improvement.
• Paul Millsap(notes), PF, UTA (per-game rank: 4)
Trending up: PTS, REB, AST, STL, FG%, FT%
Breakdown: Let me first point out that I am not at all concerned about Mehmet Okur(notes) returning and making some sort of sizable dent in Millsap’s numbers. There isn’t even a timetable yet on when he’ll back. Like Gay, Millsap too had the benefit of playing in three overtime periods this season, so it’s worth seeing if those two games had a significant impact on his averages.
Season averages: 37 MPG, 21.5 PPG, 0.3 3PTM, 9.5 RPG, 2.9 APG, 1.3 SPG, 0.7 BPG, 1.4 TO, 14.8 FGA (58.2%), 5.3 FTA (76.2%)
Non-overtime games: 36.4 MPG, 18.7 PPG, 0.1 3PTM, 9.2 RPG, 3.2 APG, 1.2 SPG, 0.7 BPG, 1.5 TO, 13.3 FGA (56.3%), 4.7 FTA (76.6%)
Much more reasonable. That takes his per-game value of 0.59 down to 0.40.
The spike in Millsap’s rebound and steal totals are a simple result of more minutes – they’re right in line with his previous per-36 averages. The assists aren’t really out of line either, maybe half-an-assist per game too high. With a stable starting role, more minutes, a higher usage rate, and more field goal attempts, it’s perfectly reasonable to believe Millsap will average 18 points a game the rest of the way.
Forecast: Once your normalize his percentages and adjust his points/steals averages, Millsap’s rest-of-season projections should look like this: 18.1 PPG, 9.2 RPG, 2.4 APG, 1.2 SPG, 0.7 BPG, 1.5 TO, 13.5 FGA (54%), 5 FTA (70%). That equates to a per-game value of 0.27, which would tie him for 22nd in per-game value. So am I saying he is going to put up (roughly) top-25 per-game value the rest of the way? You bet.

•Serge Ibaka(notes), C, OKC (per-game rank: 11)
Trending up: PTS, REB, STL, BLK, FG%, FT%
Breakdown: Since Ibaka only has one season in the books (where he played 18.1 minutes a game), the only way to accurately measure progress is through per-minute metrics. The points and field-goal percentage look to be right in line, factoring in for improvement and the three additional field-goal attempts. Yes, his FG% has jumped almost five percent, but he showed marked improvement over the second half of last season (+6.2%) when he began to adjust to the NBA game (remember, he came over from ACB League in Spain). Ibaka’s rebound rate is actually down from last season (17.2 to 15.9), so if anything, there’s bounce back potential there. His steals are right where they should be as his per-36 minute average hasn’t changed at all.
That leaves blocks and free-throw percentage. Ibaka’s block rate is up from 5.5% to 6.2%, a fairly natural increase when you look at the year-by-year progress of some of the league’s best shot blockers (Dwight Howard, Josh Smith). Because of that, I wouldn’t say his current average is fluky or bound to come down much (if at all). 2.2 blocks per game is a very, very conservative projection; 2.5 blocks per game is more likely. As for his free-throw percentage, that’s kind of up in the air. He shot 72.1 percent in 31 games when he played in the ACB, dipped to 63 percent in 73 games for the Thunder last season, and has shot up to 82.9 percent this season. His weighted free-throw percentage average is 68 percent, so it looks like he’s due for some normalization.
Forecast: I’m not gonna lie, I’m loving me some Serge Ibaka (though I don’t own him in any leagues). Like I said earlier this week, I can’t even put a cap on his ceiling value as it is really as high as he and coach Scott Brooks want it to be. It’s a travesty that he isn’t a regular starter for the Thunder at this point. Of all the five-man units that Brooks has implemented this season, the most successful have all involved Ibaka. Brooks isn’t half as erratic as Kurt Rambis or Paul Westphal though, so there’s no real reason to be concerned on the coaching front. Normalize Ibaka’s free-throw percentage and his per-game value drops from 0.40 to 0.29, moving him from 11th in per-game value to 21st. Not bad at all, especially since his current averages are totally sustainable. Now I’m not exactly claiming he’ll finish in the top-25, but merely pointing out that he has that kind of potential. A top-40 finish appears more likely so I would highly recommend that you buy (hard) while you still can.
• Roy Hibbert(notes), C, IND (per-game rank: 22)
Trending up: PTS, REB, AST, STL, BLK, FT%
Breakdown: Hibbert’s scoring average may be about half a point too high because of his abnormally high free-throw percentage, which matters because he’s getting to the line almost five times a game this year. Just because he upped his FT% by almost 10 percent last season doesn’t mean that a 7.5 percent increase this year follows some sort of pattern. He was in the mid-to-high 60s for the majority of his college career and shot 66.7 percent his rookie season. Hibbert hasn’t shown any major improvement in his conversion rate on mid-range or long two attempts to suggest legitimate improvement in that area of his game.
To go from 22nd amongst centers in rebound rate to third in just one season is virtually unheard of, and for good reason, because it just doesn’t happen often. As much as I want to scream outlier, it kind of makes sense in a theoretical sort of way with Troy Murphy(notes) gone. Murphy went through the same rebound rate spike in his second full season with the Pacers when Jermaine O’Neal(notes) left for Toronto. I don’t really subscribe to the “well someone has to” view of things, but that’s kind of what’s happening here. Josh McRoberts(notes) and Tyler Hansbrough(notes) are rather average rebounders for their position with rebound rates around 14-15, leaving Hibbert plenty of opportunities. The reduction in body fat and working with Bill Walton over the summer didn’t hurt either as his overall athleticism/quickness has improved.
Forecast: More than a few saw a breakout coming, but obviously not to this extent. Hibbert has impressed me with marked improvement in the rebounds/blocks department, but that doesn’t mean he’s not due for some regression there. 9.5 rebounds and 2.3 blocks per game are more reasonable expectations moving forward. The points and assists will dip a bit, as will his free-throw percentage, but I remain generally optimistic about his outlook. I’m projecting: 31 MPG, 15.9 PPG, 9.5 RPG, 3.2 APG, 0.4 SPG, 2.3 BPG, 2.6 TO, 12.8 FGA (48.5%), 4.5 FTA (77.5%). That equates to a per-game value of 0.21, which would put him just inside the top-35.

•John Wall(notes), PG, WAS (per-game rank: 26)
Trending up: N/A
Breakdown: As it stands Wall’s numbers look a lot like Chris Paul’s, minus the efficiency. I’m not saying that he is near Paul’s level now or necessarily will be, but that’s really the only way to aptly frame what he has been able to do so far as a rookie. The vast majority of his value comes from two categories: assists and steals. His categorical impact in steals (+4.06 standard deviations) is the second largest categorical positive out there, second to Rajon Rondo’s(notes) impact in assists (+4.80). Only nine players have averaged at least three steals over a 65+ game schedule in NBA history, none of them rookies, so history is certainly against Wall here.
Also it’s worth noting that his numbers have been considerably down in the five games where Gilbert Arenas(notes) has played:
With Arenas: 37.6 MPG, 14.8 PPG, 1 3PTM, 4.8 RPG, 9.4 APG, 2.8 SPG, 0.4 BPG, 4.2 TO, 14.2 FGA (42.3%), 2.6 FTA (69.2%)
Without Arenas: 40.3 MPG, 23.7 PPG, 0.7 3PTM, 2.7 RPG, 10.3 APG, 4 SPG, 0 BPG, 4.7 TO, 17.3 FGA (46.2%), 9 FTA (77.8%)
Forecast: His average per-game value with Arenas (free-throw percentage at 75%, not 69.2%) is 0.20, which would put him just inside the top-35. For those of you wondering, I’m not at all worried about this ominous “rookie wall”, which in reality, is just a myth and another way of repackaging a slump or random statistical fluctuation with any other player. What I am concerned about is the feasibility of Wall averaging 9 assists and 2.5 steals moving forward. The only rookie to ever accomplish that feat was Mark Jackson in ’87-’88. The more we start re-adjusting his assist/steal averages, the further Wall slips in the rankings because most of his value is vested in those areas. You catch my drift here. My rest of season projections: 17.2 PPG, 0.9 3PTM, 4.2 RPG, 8.6 APG, 2.3 SPG, 15 FGA (44.5%), 4.5 FTA (75.0%). In other words, expect his per-game rank to resemble more of what we saw from Tyreke Evans(notes) (71) last season than Stephen Curry(notes) (11).
• Wilson Chandler, F, NYK (per-game rank: 27)
Trending up: PTS, 3PTM, BLK
Breakdown: The real story here is the jump in the blocks, up from 0.8 to 2.4 per game. Without the increase in blocks his per-game rank would go from 27th to 68th.
Block percentage (most recent first): 5.3%, 1.6%, 2.0%, 1.8%
Blocks per-40 minutes (pace adjusted): 2.9, 0.8, 1.0, 0.9 (NBA), 1.8, 2.2 (college)
If there’s something there that suggests his block average is sustainable, I’m missing it.
Forecast: I buy a moderate increase in his block average because he’s moved from the swing spots to playing both forward positions, but tripling his average in one season is absurd. I can maybe buy him blocking 1.5 shots per game the rest of the way, but definitely not 2.4. The good news is that his points and threes made averages are totally sustainable. Generally I buy Chandler the rest of the way as he has and will continue to thrive in the Shawn Marion(notes) role within D’Antoni’s offense. A top-30 finish isn’t realistic, but finishing in the top-65 certainly is.
Follow Justin on Twitter @jphanned
-----
Photos via Getty Images
