
 Yahoo Sports
What percentage of league-wide revenues did CFL players get in 2013 under the old CBA?

For most of the months of labour-negotiation battles, it looked like the primary divide between the CFL and the CFLPA would be on the fundamental and philosophical issue of revenue-sharing. While regaining revenue sharing (which was in CBAs prior to the 2010 one) was a clear focus for the union here, the CFL insisted that wasn't going to happen, and the players finally cracked on May 29. The eventual tentative deal the sides agreed to Saturday (which still faces a ratification battle) involves a flat cap of $5 million in 2014 with $50,000 increases in each subsequent year, and it's not tied to league revenues (other than a revenue-protection clause that allows this CBA to be renegotiated early if league-wide pre-Grey Cup revenues rise by $27 million in the next three years). However, the numbers here are still a part of league revenues, even if they're not calculated based on those. What were percentage of revenues were players making under the old deal, and what percentage would they receive if they ratify the new deal? Let's look at the old deal first. The likely percentages under the new deal are here.
We can't figure out the exact league-wide revenues for 2013 with only three of nine teams making their financial statements public, but we can get a good idea of what they are based on those public statements, as well as other comments the CFL has made about its teams' finances. Let's start with those three teams that did make 2013 financial statements public; the Saskatchewan Roughriders, the Winnipeg Blue Bombers and the Edmonton Eskimos. Those teams are believed to be the league's wealthiest. With last year's salary cap set at $4.4 million, the Roughriders paid 10.0 per cent of pre-Grey Cup revenues ($43.8 million) in capped player compensation, while the Bombers paid at most 16.5 per cent of their revenues ($24.2 million) and the Edmonton Eskimos paid at most 21.5 per cent of theirs ($18.6 million). (Saskatchewan went over the cap, so we know they paid $4,417,975 in player salaries under the cap; Edmonton and Winnipeg did not exceed the cap, so we don't know exactly what they spent on capped player salaries, but it was less than $4.4 million.)
What about the rest of the teams? No public financials are available for anyone else, but we do have a few interesting insights that give us part of the picture. This Herb Zurkowsky piece pegged league-wide revenues in 2013 as less than $200 million. (That is from a league source, so keep potential bias in mind; however, with a league source involved and using "less than," it seems likely that number would be pretty close to the actual revenues.) $86.6 million is accounted for in those previously mentioned 2013 profits from Saskatchewan, Winnipeg and Edmonton; the Roughriders made another $25 million off the 2013 Grey Cup, bringing the known revenues to $111.6 million. If the league's statement of total revenues being under $200 million in 2013 is accurate, that leaves at most $88.4 million for five teams' revenues (keep in mind Ottawa wasn't playing in 2013) and the non-distributed parts of league-wide revenues (part of TV and national sponsorship deals are retained to pay league office costs). If all of those six shares were equal, they would be $14.7 million each. The 2014 cap of $4.4 million would be 29.9 per cent of that.
It seems more likely that those shares aren't exactly equal. Most of the league revenues are distributed, which would seem likely to make that undistributed share relatively small. There's no way to get an exact estimate on it, but let's try $5 million. With $5 million gone, that's $83.4 million (at most) left for five teams' revenues. That would be $16.7 million in revenue per team, making the $4.4 million cap 26.3 per cent of those teams revenues. Moreover, we know that the bottom five teams from 2013 were divided into a low (three-team) and a middle (two-team) group. If we presume that the teams in the middle group (supposedly B.C. and Calgary) were making less than the poorest team in the top group (Edmonton, $18.6 million in revenues), there's a potential solution here of around $17.7 million in revenues for the Lions and Stampeders and around $16 million for the three bottom teams. That doesn't seem terribly unrealistic, as Zurkowsky was told by a league source that Montreal (believed to be a bottom team) had total revenues of $12-14 million a couple of years ago, and they've probably made some strides since then.
(Another alternative scenario has Toronto and Hamilton really struggling in 2013 thanks to stadium issues. If those teams both brought in around $12 million in revenues and Montreal brought in around $16 million, the two middle teams (B.C. and Calgary) would have made about $21.7 million in revenue each and paid out 20.3 per cent of that in capped compensation. This analysis would have B.C. and Calgary bringing in more in revenue than the supposedly-rich Eskimos, but making a smaller profit thanks to spending more. Interestingly enough, though, this analysis is the only one where any team would have been paying more than the 35 per cent of revenues players asked for, as teams with $12 million in revenue would spend 36.7 per cent of it on capped compensation if they spent to a $4.4 million cap.)
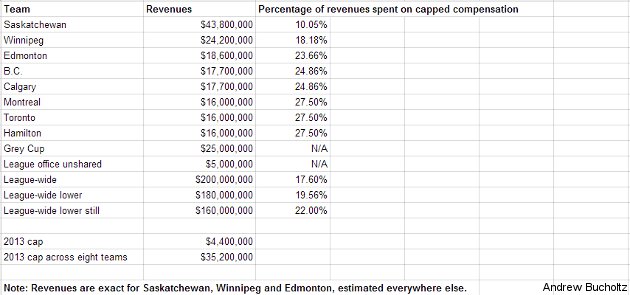
The most interesting number may be the league-wide one, which we can get a further handle on from that source's comment of total revenues being under $200 million. If every team spent to the cap in 2013, the total amount of capped compensation would have been $35.2 million. (The Riders were $17,975 over the cap, but everyone else was under, so the $35.2 million estimate is a generous one.) If league revenues were $200 million exactly, that's just 17.6 per cent of league revenues going to players. Even if we assume league revenues were substantially less than $200 million, say, $180 million or $160 million, those percentages only rise to 19.6 per cent and 22.0 per cent respectively. Here's a table showing what percentage of estimated revenues each team and the whole league spent on capped salaries in 2013:
Thus, as previously mentioned, a lot of CFL revenues weren't going to players under the previous CBA. An estimate of just $160 million for league revenues seems very low, and yet, even that would mean 78 per cent of league revenues weren't going to players in capped compensation. (It is worth noting that there have also been substantial divides on uncapped compensation, but under the league's "best and final" proposal, that was expected to be $250,000 per team beyond the cap; if similar uncapped compensation existed under the previous CBA, that's still only $2 million across eight teams, and that only bumps the players' percentage to 18.6 per cent of $200 million, 20.7 per cent of $180 million and 23.3 per cent of $160 million in league-wide revenues.) How's that going to change in the new CBA? Read on here to find out.
