
 Yahoo Sports
 Why You Should Care About Scholium Group Plc’s (LON:SCHO) Low Return On Capital

Today we'll evaluate Scholium Group Plc (LON:SCHO) to determine whether it could have potential as an investment idea. To be precise, we'll consider its Return On Capital Employed (ROCE), as that will inform our view of the quality of the business.
First, we'll go over how we calculate ROCE. Then we'll compare its ROCE to similar companies. Last but not least, we'll look at what impact its current liabilities have on its ROCE.
What is Return On Capital Employed (ROCE)?
ROCE is a metric for evaluating how much pre-tax income (in percentage terms) a company earns on the capital invested in its business. All else being equal, a better business will have a higher ROCE. In brief, it is a useful tool, but it is not without drawbacks. Renowned investment researcher Michael Mauboussin has suggested that a high ROCE can indicate that 'one dollar invested in the company generates value of more than one dollar'.
How Do You Calculate Return On Capital Employed?
Analysts use this formula to calculate return on capital employed:
Return on Capital Employed = Earnings Before Interest and Tax (EBIT) ÷ (Total Assets - Current Liabilities)
Or for Scholium Group:
0.012 = UK£122k ÷ (UK£12m - UK£2.3m) (Based on the trailing twelve months to September 2019.)
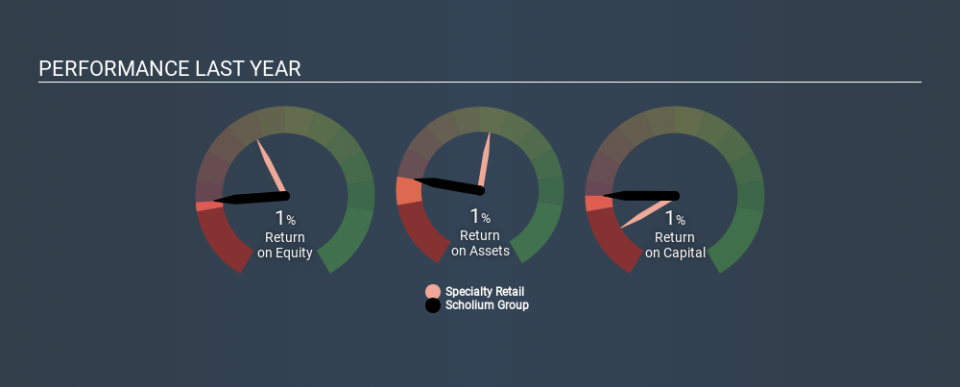
Therefore, Scholium Group has an ROCE of 1.2%.
See our latest analysis for Scholium Group
Does Scholium Group Have A Good ROCE?
ROCE is commonly used for comparing the performance of similar businesses. We can see Scholium Group's ROCE is meaningfully below the Specialty Retail industry average of 8.6%. This could be seen as a negative, as it suggests some competitors may be employing their capital more efficiently. Putting aside Scholium Group's performance relative to its industry, its ROCE in absolute terms is poor - considering the risk of owning stocks compared to government bonds. Readers may wish to look for more rewarding investments.
Scholium Group has an ROCE of 1.2%, but it didn't have an ROCE 3 years ago, since it was unprofitable. That implies the business has been improving. You can see in the image below how Scholium Group's ROCE compares to its industry. Click to see more on past growth.
It is important to remember that ROCE shows past performance, and is not necessarily predictive. ROCE can be deceptive for cyclical businesses, as returns can look incredible in boom times, and terribly low in downturns. ROCE is only a point-in-time measure. How cyclical is Scholium Group? You can see for yourself by looking at this free graph of past earnings, revenue and cash flow.
Do Scholium Group's Current Liabilities Skew Its ROCE?
Short term (or current) liabilities, are things like supplier invoices, overdrafts, or tax bills that need to be paid within 12 months. Due to the way ROCE is calculated, a high level of current liabilities makes a company look as though it has less capital employed, and thus can (sometimes unfairly) boost the ROCE. To counteract this, we check if a company has high current liabilities, relative to its total assets.
Scholium Group has current liabilities of UK£2.3m and total assets of UK£12m. As a result, its current liabilities are equal to approximately 19% of its total assets. This is not a high level of current liabilities, which would not boost the ROCE by much.
What We Can Learn From Scholium Group's ROCE
While that is good to see, Scholium Group has a low ROCE and does not look attractive in this analysis. Of course, you might also be able to find a better stock than Scholium Group. So you may wish to see this free collection of other companies that have grown earnings strongly.
For those who like to find winning investments this free list of growing companies with recent insider purchasing, could be just the ticket.
If you spot an error that warrants correction, please contact the editor at editorial-team@simplywallst.com. This article by Simply Wall St is general in nature. It does not constitute a recommendation to buy or sell any stock, and does not take account of your objectives, or your financial situation. Simply Wall St has no position in the stocks mentioned.
We aim to bring you long-term focused research analysis driven by fundamental data. Note that our analysis may not factor in the latest price-sensitive company announcements or qualitative material. Thank you for reading.
