
 Yahoo Sports
 Is Tse Sui Luen Jewellery (International) Limited (HKG:417) Investing Effectively In Its Business?

Today we are going to look at Tse Sui Luen Jewellery (International) Limited (HKG:417) to see whether it might be an attractive investment prospect. Specifically, we'll consider its Return On Capital Employed (ROCE), since that will give us an insight into how efficiently the business can generate profits from the capital it requires.
Firstly, we'll go over how we calculate ROCE. Second, we'll look at its ROCE compared to similar companies. And finally, we'll look at how its current liabilities are impacting its ROCE.
Understanding Return On Capital Employed (ROCE)
ROCE measures the amount of pre-tax profits a company can generate from the capital employed in its business. All else being equal, a better business will have a higher ROCE. Ultimately, it is a useful but imperfect metric. Author Edwin Whiting says to be careful when comparing the ROCE of different businesses, since 'No two businesses are exactly alike.
How Do You Calculate Return On Capital Employed?
The formula for calculating the return on capital employed is:
Return on Capital Employed = Earnings Before Interest and Tax (EBIT) ÷ (Total Assets - Current Liabilities)
Or for Tse Sui Luen Jewellery (International):
0.075 = HK$136m ÷ (HK$2.9b - HK$1.1b) (Based on the trailing twelve months to September 2019.)
Therefore, Tse Sui Luen Jewellery (International) has an ROCE of 7.5%.
Check out our latest analysis for Tse Sui Luen Jewellery (International)
Is Tse Sui Luen Jewellery (International)'s ROCE Good?
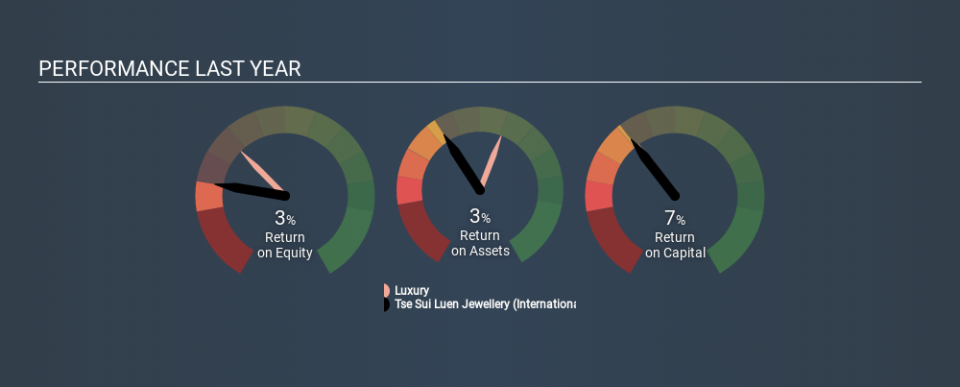
ROCE can be useful when making comparisons, such as between similar companies. We can see Tse Sui Luen Jewellery (International)'s ROCE is around the 9.3% average reported by the Luxury industry. Separate from how Tse Sui Luen Jewellery (International) stacks up against its industry, its ROCE in absolute terms is mediocre; relative to the returns on government bonds. Investors may wish to consider higher-performing investments.
The image below shows how Tse Sui Luen Jewellery (International)'s ROCE compares to its industry, and you can click it to see more detail on its past growth.
When considering ROCE, bear in mind that it reflects the past and does not necessarily predict the future. Companies in cyclical industries can be difficult to understand using ROCE, as returns typically look high during boom times, and low during busts. This is because ROCE only looks at one year, instead of considering returns across a whole cycle. You can check if Tse Sui Luen Jewellery (International) has cyclical profits by looking at this free graph of past earnings, revenue and cash flow.
What Are Current Liabilities, And How Do They Affect Tse Sui Luen Jewellery (International)'s ROCE?
Short term (or current) liabilities, are things like supplier invoices, overdrafts, or tax bills that need to be paid within 12 months. Due to the way the ROCE equation works, having large bills due in the near term can make it look as though a company has less capital employed, and thus a higher ROCE than usual. To counteract this, we check if a company has high current liabilities, relative to its total assets.
Tse Sui Luen Jewellery (International) has current liabilities of HK$1.1b and total assets of HK$2.9b. Therefore its current liabilities are equivalent to approximately 37% of its total assets. Tse Sui Luen Jewellery (International)'s middling level of current liabilities have the effect of boosting its ROCE a bit.
Our Take On Tse Sui Luen Jewellery (International)'s ROCE
Unfortunately, its ROCE is still uninspiring, and there are potentially more attractive prospects out there. Of course, you might also be able to find a better stock than Tse Sui Luen Jewellery (International). So you may wish to see this free collection of other companies that have grown earnings strongly.
If you are like me, then you will not want to miss this free list of growing companies that insiders are buying.
If you spot an error that warrants correction, please contact the editor at editorial-team@simplywallst.com. This article by Simply Wall St is general in nature. It does not constitute a recommendation to buy or sell any stock, and does not take account of your objectives, or your financial situation. Simply Wall St has no position in the stocks mentioned.
We aim to bring you long-term focused research analysis driven by fundamental data. Note that our analysis may not factor in the latest price-sensitive company announcements or qualitative material. Thank you for reading.
