
 Yahoo Sports
 States Whose Economies Are Failing vs. States Whose Economies Are Thriving

Economic fluctuations over the past three years have been so volatile, many Americans have been left reeling trying to keep up with what to expect. The COVID-19 pandemic brought the economy to a near halt in 2020, when the unemployment rate shot up to an all-time record of 14.7% in April 2020. Both the overall rate of 14.7% and the 10.3% jump from the prior month were the highest on record since the Bureau of Labor Statistics began keeping statistics in January 1948.
While the economy has begun to stabilize, both in terms of the unemployment rate and year-over-year GDP, many parts of the country have experienced significant economic fluctuations, some for the better, but many for the worse. Though record high inflation has begun to chill some, an overall increase in cost of living has left a trace. Some states have already rebounded nearly to pre-pandemic levels, while others struggle to return to a state of balance.
To determine which economies are thriving and which are failing, GOBankingRates took a look at a variety of economic factors, from year-over-year GDP growth rate and unemployment rates to wage changes and the percentage of a state's population that is living in poverty. States -- including Washington D.C., which is not a state, but a sizable economy -- were divided into the top 15 and the bottom 15. Read on to find out which states are at the bottom and the top of this split recovery.
Warren Buffett's Financial Plan to Tackle America's Debt: 'I Can End the Deficit in 5 Minutes'
Learn: What To Do If You Owe Back Taxes to the IRS

States Whose Economies Are Failing
These states are still struggling with economic challenges. Although overall unemployment trends are improving, residents of these states may still have trouble finding jobs and contributing to the state's GDP.
Housing Market 2023: These 15 Cities Are Poised for the Most Stable Growth and Are Likely To Keep Their Value
Stimulus 2023: Updates To Know Now

Mississippi
July 2023 unemployment rate: 3.0%
GDP growth Q4 2022 to Q1 2023: 4.9%
Average weekly wages Q1 2023: $944
Percent of population below poverty line 2021: 19.4%
Discover: 10 Affordable U.S. Small Towns With a Great Quality of Life

West Virginia
July 2023 unemployment rate: 3.4%
GDP growth Q4 2022 to Q1 2023: -2.9%
Average weekly wages Q1 2023: $1,062
Percent of population below poverty line 2021: 16.9%

New Mexico
July 2023 unemployment rate: 3.6%
GDP growth Q4 2022 to Q1 2023: 1.6%
Average weekly wages Q1 2023: $1,105
Percent of population below poverty line 2021: 18.3%

Louisiana
July 2023 unemployment rate: 3.4%
GDP growth Q4 2022 to Q1 2023: 3.7%
Average weekly wages Q1 2023: $1,150
Percent of population below poverty line 2021: 18.8%

Arkansas
July 2023 unemployment rate: 2.6%
GDP growth Q4 2022 to Q1 2023: 3.4%
Average weekly wages Q1 2023: $1,127
Percent of population below poverty line 2021: 16%
I'm a Millionaire: Why I'm Not Passing Generational Wealth to My Kids

Rhode Island
July 2023 unemployment rate: 2.8%
GDP growth Q4 2022 to Q1 2023: 5.3%
Average weekly wages Q1 2023: $1,334
Percent of population below poverty line 2021: 11.3%
Oklahoma
July 2023 unemployment rate: 2.7%
GDP growth Q4 2022 to Q1 2023: 0.0%
Average weekly wages Q1 2023: $1,109
Percent of population below poverty line 2021: 15.2%
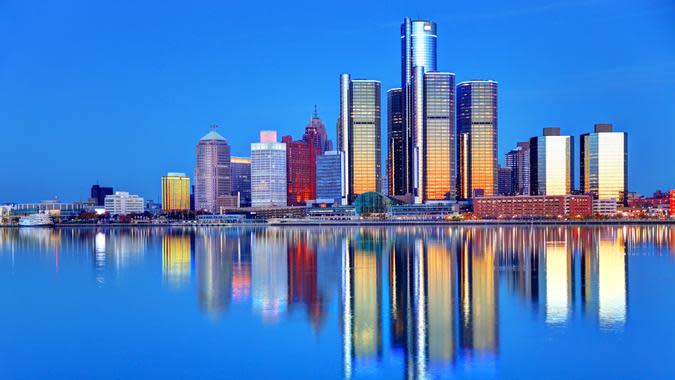
Michigan
July 2023 unemployment rate: 3.6%
GDP growth Q4 2022 to Q1 2023: 6.5%
Average weekly wages Q1 2023: $1,308
Percent of population below poverty line 2021: 13.3%

Indiana
July 2023 unemployment rate: 3.3%
GDP growth Q4 2022 to Q1 2023: 5.4%
Average weekly wages Q1 2023: $1,203
Percent of population below poverty line 2021: 12.5%
See: 7 States Considering More Stimulus Checks in 2023
New York
July 2023 unemployment rate: 3.9%
GDP growth Q4 2022 to Q1 2023: 7.3%
Average weekly wages Q1 2023: $2,015
Percent of population below poverty line 2021: 13.5%

Illinois
July 2023 unemployment rate: 4.0%
GDP growth Q4 2022 to Q1 2023: 5.4%
Average weekly wages Q1 2023: $1,567
Percent of population below poverty line 2021: 11.8%

Wyoming
July 2023 unemployment rate: 3.0%
GDP growth Q4 2022 to Q1 2023: -2.0%
Average weekly wages Q1 2023: $1,145
Percent of population below poverty line 2021: 10.7%

Kentucky
July 2023 unemployment rate: 3.8%
GDP growth Q4 2022 to Q1 2023: 7.2%
Average weekly wages Q1 2023: $1,138
Percent of population below poverty line 2021: 16.3%
'Get Rich Slow': Dave Ramsey Offers the Key to Lasting Wealth

Ohio
July 2023 unemployment rate: 3.3%
GDP growth Q4 2022 to Q1 2023: 6.0%
Average weekly wages Q1 2023: $1,265
Percent of population below poverty line 2021: 13.4%

Arizona
July 2023 unemployment rate: 3.6%
GDP growth Q4 2022 to Q1 2023: 6.6%
Average weekly wages Q1 2023: $1,330
Percent of population below poverty line 2021: 13.5%

States Whose Economies Are Thriving
If you live in one of these states, you've probably noticed the signs of economic improvement. Unemployment and GDP levels are recovering nicely in these areas. Here's a look at the 15 states that are seeing the strongest signs of economic stability.
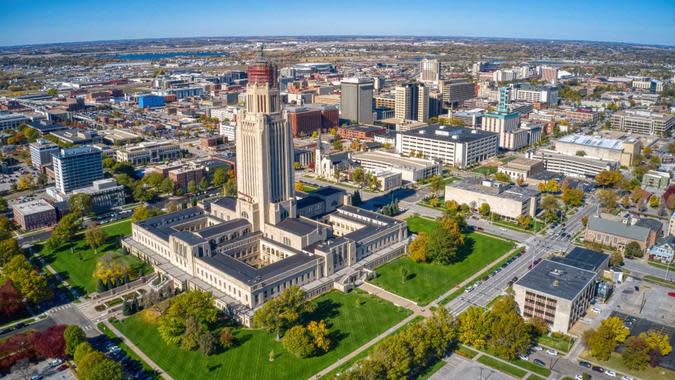
Nebraska
July 2023 unemployment rate: 2.0%
GDP growth Q4 2022 to Q1 2023: 14.1%
Average weekly wages Q1 2023: $1,165
Percent of population below poverty line 2021: 10.3%
I'm a Real Estate Agent: These Will Be the Best States To Buy Property in the Next 5 Years

Massachusetts
July 2023 unemployment rate: 2.5%
GDP growth Q4 2022 to Q1 2023: 8.5%
Average weekly wages Q1 2023: $1,917
Percent of population below poverty line 2021: 9.9%

New Hampshire
July 2023 unemployment rate: 1.7%
GDP growth Q4 2022 to Q1 2023: 6.8%
Average weekly wages Q1 2023: $1,462
Percent of population below poverty line 2021: 7.4%

Maryland
July 2023 unemployment rate: 1.8%
GDP growth Q4 2022 to Q1 2023: 5.8%
Average weekly wages Q1 2023: $1,541
Percent of population below poverty line 2021: 9.2%

Washington
July 2023 unemployment rate: 3.6%
GDP growth Q4 2022 to Q1 2023: 7.6%
Average weekly wages Q1 2023: $1,721
Percent of population below poverty line 2021: 10%
Food Stamps: Surprising Things You Can Buy
North Dakota
July 2023 unemployment rate: 2.0%
GDP growth Q4 2022 to Q1 2023: 3.6%
Average weekly wages Q1 2023: $1,216
Percent of population below poverty line 2021: 10.7%

Utah
July 2023 unemployment rate: 2.4%
GDP growth Q4 2022 to Q1 2023: 5.9%
Average weekly wages Q1 2023: $1,245
Percent of population below poverty line 2021: 8.8%

Virginia
July 2023 unemployment rate: 2.5%
GDP growth Q4 2022 to Q1 2023: 6.4%
Average weekly wages Q1 2023: $1,477
Percent of population below poverty line 2021: 9.9%

Florida
July 2023 unemployment rate: 2.7%
GDP growth Q4 2022 to Q1 2023: 8.8%
Average weekly wages Q1 2023: $1,130
Percent of population below poverty line 2021: 13.1%
Check Out: 5 Places To Live in Europe That Are So Cheap You Could Quit Your Job

Idaho
July 2023 unemployment rate: 2.8%
GDP growth Q4 2022 to Q1 2023: 6.3%
Average weekly wages Q1 2023: $1,084
Percent of population below poverty line 2021: 11.4%

District of Columbia
July 2023 unemployment rate: 5.0%
GDP growth Q4 2022 to Q1 2023: 7.3%
Average weekly wages Q1 2023: $2,341
Percent of population below poverty line 2021: 15.4%

South Dakota
July 2023 unemployment rate: 1.9%
GDP growth Q4 2022 to Q1 2023: 11.0%
Average weekly wages Q1 2023: $1,084
Percent of population below poverty line 2021: 12.5%

Hawaii
July 2023 unemployment rate: 2.8%
GDP growth Q4 2022 to Q1 2023: 8.1%
Average weekly wages Q1 2023: $1,218
Percent of population below poverty line 2021: 9.5%
I'm a Real Estate Agent: Buy Real Estate in These 10 Cities To Be Rich in 10 Years

Colorado
July 2023 unemployment rate: 2.9%
GDP growth Q4 2022 to Q1, 2023: 5.4%
Average weekly wages Q1 2023: $1,559
Percent of population below poverty line 2021: 9.6%

Minnesota
July 2023 unemployment rate: 3.0%
GDP growth Q4 2022 to Q1 2023: 6.3%
Average weekly wages Q1 2023: $1,461
Percent of population below poverty line 2021: 9.2%
John Csiszar contributed to the reporting of this article.
Methodology: GOBankingRates analyzed the following seven factors for each state and the District of Columbia to gauge the health of their economies: (1) the July 2023 unemployment rate according to the Bureau of Labor Statistics' (BLS) Local Area Unemployment Statistics data; (2) the year-over-year change in nonfarm payroll jobs as of July 2023 according to the BLS's State and Metro Area Employment, Hours, & Earnings data; (3) the Q1 2023 GDP per capita in current dollars, calculated by using population data from the Census Bureau's American Community Survey (ACS) 2021 estimates and the Bureau of Economic Analysis's (BEA) most recent GDP by State release; (4) the percent by which GDP grew between the fourth quarter of 2022 and the first quarter of 2023, also according to the BEA's GDP release; (5) the average weekly wage in Q1 2023 according to the BLS's Economic News Release; (6) the percent change in the average weekly wage between Q1 2022 and Q1 2023, also according to the BLS Economic News Release; and (7) the percent of the population that was living below the poverty line in 2021, according to the Census Bureau's 2021 ACS 5-year data. States were scored on all factors and ranked against each other based on their combined total score. The states with the lowest combined scores were identified as states with thriving economies and the states with the highest combined scores were identified as states with failing economies. All data was collected on and up to date as of Aug. 24, 2023.
More From GOBankingRates
This article originally appeared on GOBankingRates.com: States Whose Economies Are Failing vs. States Whose Economies Are Thriving
