
 Yahoo Sports
 A Sliding Share Price Has Us Looking At Henderson Investment Limited's (HKG:97) P/E Ratio

To the annoyance of some shareholders, Henderson Investment (HKG:97) shares are down a considerable 31% in the last month. Indeed the recent decline has arguably caused some bitterness for shareholders who have held through the 38% drop over twelve months.
All else being equal, a share price drop should make a stock more attractive to potential investors. While the market sentiment towards a stock is very changeable, in the long run, the share price will tend to move in the same direction as earnings per share. The implication here is that long term investors have an opportunity when expectations of a company are too low. One way to gauge market expectations of a stock is to look at its Price to Earnings Ratio (PE Ratio). Investors have optimistic expectations of companies with higher P/E ratios, compared to companies with lower P/E ratios.
See our latest analysis for Henderson Investment
How Does Henderson Investment's P/E Ratio Compare To Its Peers?
Henderson Investment's P/E of 21.14 indicates some degree of optimism towards the stock. You can see in the image below that the average P/E (10.6) for companies in the multiline retail industry is lower than Henderson Investment's P/E.
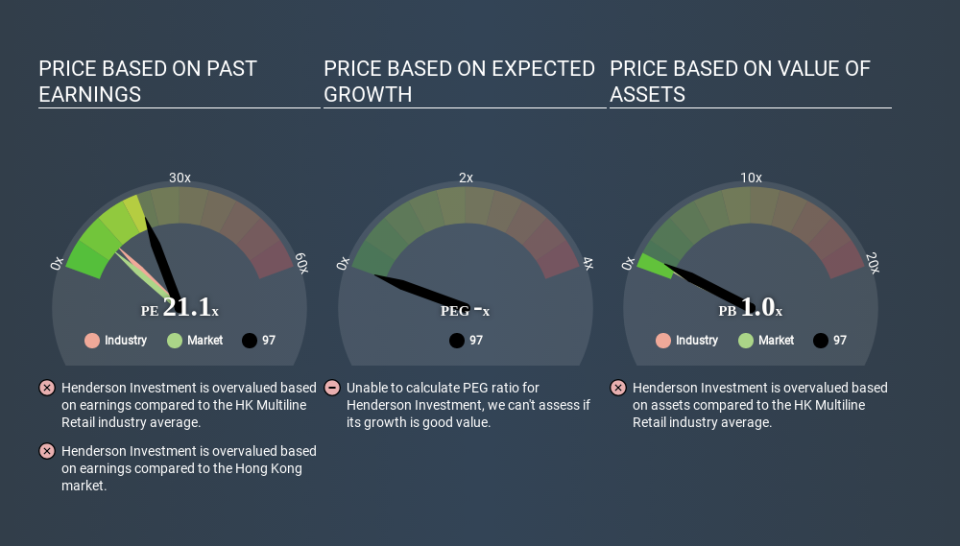
Henderson Investment's P/E tells us that market participants think the company will perform better than its industry peers, going forward. Clearly the market expects growth, but it isn't guaranteed. So investors should always consider the P/E ratio alongside other factors, such as whether company directors have been buying shares.
How Growth Rates Impact P/E Ratios
Companies that shrink earnings per share quickly will rapidly decrease the 'E' in the equation. That means unless the share price falls, the P/E will increase in a few years. So while a stock may look cheap based on past earnings, it could be expensive based on future earnings.
Henderson Investment's earnings per share fell by 36% in the last twelve months. But EPS is up 18% over the last 5 years. And over the longer term (3 years) earnings per share have decreased 15% annually. This might lead to low expectations.
Don't Forget: The P/E Does Not Account For Debt or Bank Deposits
One drawback of using a P/E ratio is that it considers market capitalization, but not the balance sheet. So it won't reflect the advantage of cash, or disadvantage of debt. Theoretically, a business can improve its earnings (and produce a lower P/E in the future) by investing in growth. That means taking on debt (or spending its cash).
Such spending might be good or bad, overall, but the key point here is that you need to look at debt to understand the P/E ratio in context.
So What Does Henderson Investment's Balance Sheet Tell Us?
With net cash of HK$389m, Henderson Investment has a very strong balance sheet, which may be important for its business. Having said that, at 29% of its market capitalization the cash hoard would contribute towards a higher P/E ratio.
The Bottom Line On Henderson Investment's P/E Ratio
Henderson Investment's P/E is 21.1 which is above average (9.0) in its market. The recent drop in earnings per share might keep value investors away, but the net cash position means the company has time to improve: and the high P/E suggests the market thinks it will. Given Henderson Investment's P/E ratio has declined from 30.5 to 21.1 in the last month, we know for sure that the market is significantly less confident about the business today, than it was back then. For those who prefer to invest with the flow of momentum, that might be a bad sign, but for a contrarian, it may signal opportunity.
Investors have an opportunity when market expectations about a stock are wrong. If the reality for a company is better than it expects, you can make money by buying and holding for the long term. We don't have analyst forecasts, but you could get a better understanding of its growth by checking out this more detailed historical graph of earnings, revenue and cash flow.
Of course you might be able to find a better stock than Henderson Investment. So you may wish to see this free collection of other companies that have grown earnings strongly.
If you spot an error that warrants correction, please contact the editor at editorial-team@simplywallst.com. This article by Simply Wall St is general in nature. It does not constitute a recommendation to buy or sell any stock, and does not take account of your objectives, or your financial situation. Simply Wall St has no position in the stocks mentioned.
We aim to bring you long-term focused research analysis driven by fundamental data. Note that our analysis may not factor in the latest price-sensitive company announcements or qualitative material. Thank you for reading.
