
 Yahoo Sports
 Do Its Financials Have Any Role To Play In Driving PageGroup plc's (LON:PAGE) Stock Up Recently?
PageGroup (LON:PAGE) has had a great run on the share market with its stock up by a significant 25% over the last three months. We wonder if and what role the company's financials play in that price change as a company's long-term fundamentals usually dictate market outcomes. Particularly, we will be paying attention to PageGroup's ROE today.
Return on Equity or ROE is a test of how effectively a company is growing its value and managing investors’ money. In short, ROE shows the profit each dollar generates with respect to its shareholder investments.
See our latest analysis for PageGroup
How Do You Calculate Return On Equity?
The formula for return on equity is:
Return on Equity = Net Profit (from continuing operations) ÷ Shareholders' Equity
So, based on the above formula, the ROE for PageGroup is:
42% = UK£161m ÷ UK£387m (Based on the trailing twelve months to June 2022).
The 'return' is the income the business earned over the last year. That means that for every £1 worth of shareholders' equity, the company generated £0.42 in profit.
Why Is ROE Important For Earnings Growth?
We have already established that ROE serves as an efficient profit-generating gauge for a company's future earnings. We now need to evaluate how much profit the company reinvests or "retains" for future growth which then gives us an idea about the growth potential of the company. Assuming everything else remains unchanged, the higher the ROE and profit retention, the higher the growth rate of a company compared to companies that don't necessarily bear these characteristics.
PageGroup's Earnings Growth And 42% ROE
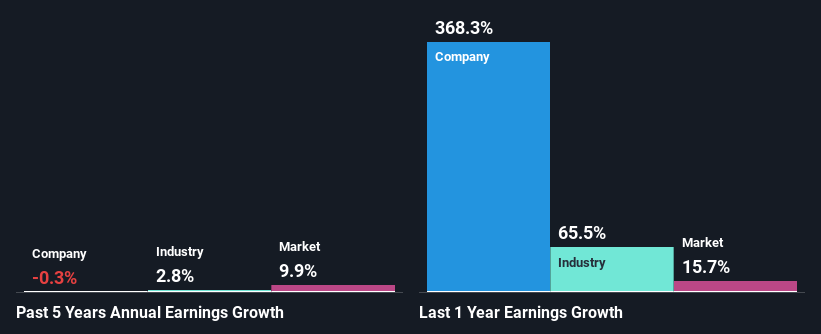
Firstly, we acknowledge that PageGroup has a significantly high ROE. Additionally, the company's ROE is higher compared to the industry average of 19% which is quite remarkable. Given the circumstances, we can't help but wonder why PageGroup saw little to no growth in the past five years. Based on this, we feel that there might be other reasons which haven't been discussed so far in this article that could be hampering the company's growth. These include low earnings retention or poor allocation of capital
As a next step, we compared PageGroup's net income growth with the industry and discovered that the industry saw an average growth of 2.8% in the same period.
Earnings growth is a huge factor in stock valuation. What investors need to determine next is if the expected earnings growth, or the lack of it, is already built into the share price. Doing so will help them establish if the stock's future looks promising or ominous. What is PAGE worth today? The intrinsic value infographic in our free research report helps visualize whether PAGE is currently mispriced by the market.
Is PageGroup Using Its Retained Earnings Effectively?
In spite of a normal three-year median payout ratio of 32% (or a retention ratio of 68%), PageGroup hasn't seen much growth in its earnings. Therefore, there might be some other reasons to explain the lack in that respect. For example, the business could be in decline.
Additionally, PageGroup has paid dividends over a period of at least ten years, which means that the company's management is determined to pay dividends even if it means little to no earnings growth. Our latest analyst data shows that the future payout ratio of the company is expected to rise to 43% over the next three years. Despite the higher expected payout ratio, the company's ROE is not expected to change by much.
Conclusion
In total, it does look like PageGroup has some positive aspects to its business. However, given the high ROE and high profit retention, we would expect the company to be delivering strong earnings growth, but that isn't the case here. This suggests that there might be some external threat to the business, that's hampering its growth. Moreover, after studying current analyst estimates, we discovered that the company's earnings are expected to continue to shrink in the future. To know more about the latest analysts predictions for the company, check out this visualization of analyst forecasts for the company.
Have feedback on this article? Concerned about the content? Get in touch with us directly. Alternatively, email editorial-team (at) simplywallst.com.
This article by Simply Wall St is general in nature. We provide commentary based on historical data and analyst forecasts only using an unbiased methodology and our articles are not intended to be financial advice. It does not constitute a recommendation to buy or sell any stock, and does not take account of your objectives, or your financial situation. We aim to bring you long-term focused analysis driven by fundamental data. Note that our analysis may not factor in the latest price-sensitive company announcements or qualitative material. Simply Wall St has no position in any stocks mentioned.
Join A Paid User Research Session
You’ll receive a US$30 Amazon Gift card for 1 hour of your time while helping us build better investing tools for the individual investors like yourself. Sign up here
