
 Yahoo Sports
CHL: Fighting has dropped over last 15 seasons
In the wake of comments made by Dave Branch and Bob Nicholson this week, as well as the story of Hockey Canada looking to curb fighting at junior levels having made it as big as the New York Times, it's probably worth pointing out that, on their own, players and teams are bringing a slow end to fighting on their own without the benefit of rules.
Using data provided by hockeyfights.net, I tallied up the number of fights that took place in every year since data for all three CHL leagues (WHL, OHL and QMJHL) was made available and found that while there was 1.91 fights per game at the CHL level in 1998, that number has reduced to just .92 fights per game.
This evidence seems to back up a point that Sunaya Sapurji made in yesterday's chat:
If you look at junior -- the days of teams giving up a roster spot to a Jeff Kugel are long, long gone. I dont think the league has anything to worry about in that respect.
Jeff Kugel, according to hockeydb, played 46 games in the OHL between the 1998 and 2000 seasons, registering a single goal and tallying 76 penalty minutes. He was listed at 6'7" and 265 lbs.
Now, while the drop in fights per game was very prevalent over the period from 1998 to 2006, there has been a much less noticeable decrease in the number of fights since then, with the average of fights per game bottoming out at 0.81 in the 2009 season. The QMJHL carried the torch that season in that respect, with just 618 fighting majors handed out over the league's 612 games, and by conversion, would equal just over one fight every two games.
The effectiveness of team fighting is also disputed. The point has been made this year that the Windsor Spitfires lead the OHL in penalty minutes and fights (the 96 scraps seen under the eye of Bob Boughner is 20 ahead of the next highest team, the Plymouth Whalers) they're still fighting for a playoff spot in the OHL's Western Conference.
My own theory on fighting is that it doesn't really matter one way or another how often a team fights in determining its success. Perhaps the best example of this is the 2009 OHL season: the Belleville Bulls and Windsor were the respective winners of their Conferences, but they were at the opposite ends of the table in fight standings.
For a visual perspective on how fighting has dropped in the last 15 years, check the graph below [click for full size]:
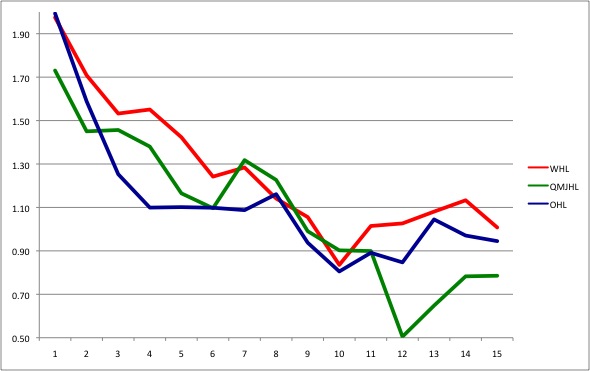
I never learned how to properly use Excel so the axis aren't labelled. The y-axis is obviously fights per game (the definition of a fight is two fighting majors) while the x-axis represents the year. Basically add 1997 to each number and you'll come up with a year (1 is 1998, 2 is 1999 and so on).
If you'd like to see the data, here's what it is for each league:
Year | CHL | WHL | QMJHL | OHL |
|---|---|---|---|---|
1998 | 1.91 | 1.97 | 1.73 | 1.99 |
1999 | 1.59 | 1.71 | 1.45 | 1.59 |
2000 | 1.41 | 1.53 | 1.46 | 1.25 |
2001 | 1.34 | 1.55 | 1.38 | 1.10 |
2002 | 1.23 | 1.42 | 1.16 | 1.10 |
2003 | 1.15 | 1.24 | 1.10 | 1.10 |
2004 | 1.23 | 1.28 | 1.32 | 1.09 |
2005 | 1.17 | 1.14 | 1.23 | 1.16 |
2006 | 1.00 | 1.06 | 0.99 | 0.94 |
2007 | 0.85 | 0.84 | 0.90 | 0.81 |
2008 | 0.94 | 1.01 | 0.90 | 0.89 |
2009 | 0.81 | 1.03 | 0.50 | 0.85 |
2010 | 0.94 | 1.08 | 0.65 | 1.04 |
2011 | 0.97 | 1.13 | 0.78 | 0.97 |
2012 | 0.92 | 1.01 | 0.79 | 0.94 |
TOTAL | 1.15 | 1.25 | 1.08 | 1.12 |
